Track usage and spending
Organization usage: Settings → Usage & Activity
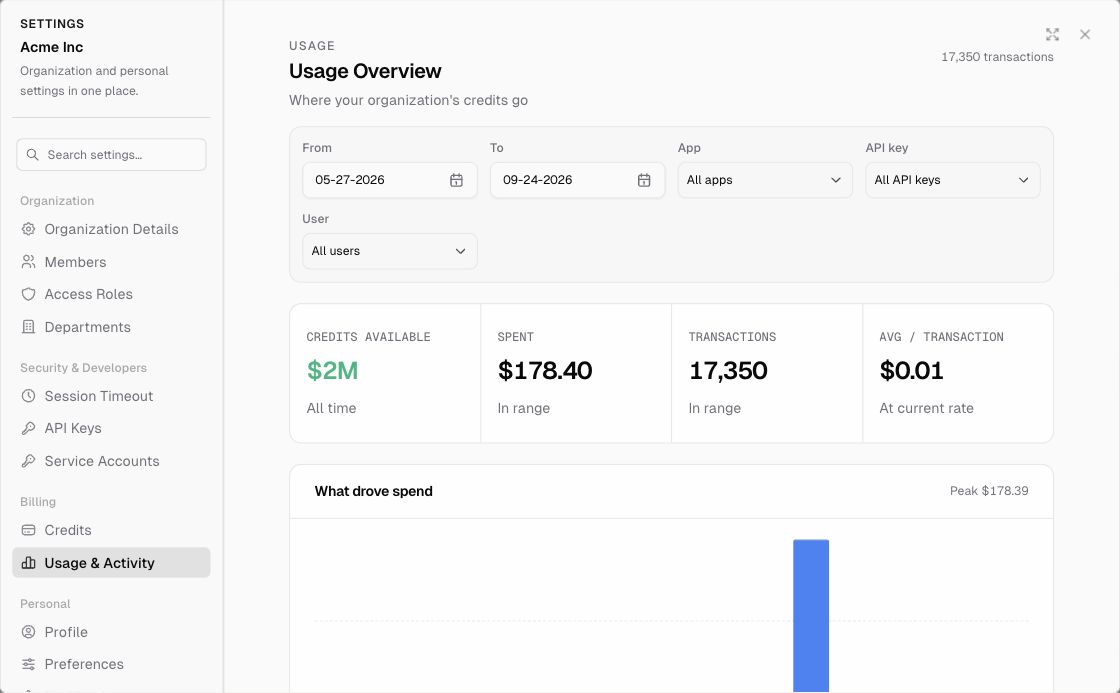
The Usage Overview shows where your organization’s credits go.
Filters: date range (From / To), App, API key, User
Summary cards
- Credits available (all time)
- Spent (in the selected range)
- Transactions (in range)
- Avg / transaction
What drove spend: a chart over time, broken down by category:
- Reads (list, get, search, aggregate)
- Writes (create, update, delete)
- AI model inference
- AI agent service fee
- Automations (workflow runs, triggers, compute)
Spend by app: a table of App, Calls, Cost, and Share, so you can see which apps use the most credits. Click an app to drill in.
Spend by API key and Spend by user: the same breakdown per key and per person.
Operations: every metered operation with its Category, Rate, Calls, Cost, and Share.
Per-app usage: Command Centre → Usage
Inside an app, open Command Centre → Usage to see that app’s activity: total events, branches, activity trend, and counts of views, documents, workflow runs, workflows, records, roles, tables, and users. See Command Centre.
Organization Dashboard
The organization Dashboard shows your credit balance alongside total records, tables, and workflow runs. See Organization dashboard.
Tips for controlling spend
- Use Trigger Conditions so workflows only run when they need to.
- Turn off Auto-update on AI Columns that don’t need to stay in sync.
- Filter with Get Records instead of reading whole tables in workflows and integrations.
- Delete records you don’t need and empty the Trash. Trash records still count toward retention.
- Filter Usage & Activity by API key to find integrations that make a lot of calls.