Command Centre overview
The Command Centre is where you manage an app’s lifecycle: plan it, track issues, release changes safely, back it up, monitor usage and data health, and expose it to other software.
Open the Command Centre
Click the app name (top left) and choose Command Centre. Click Open App (top right) to return to the app.
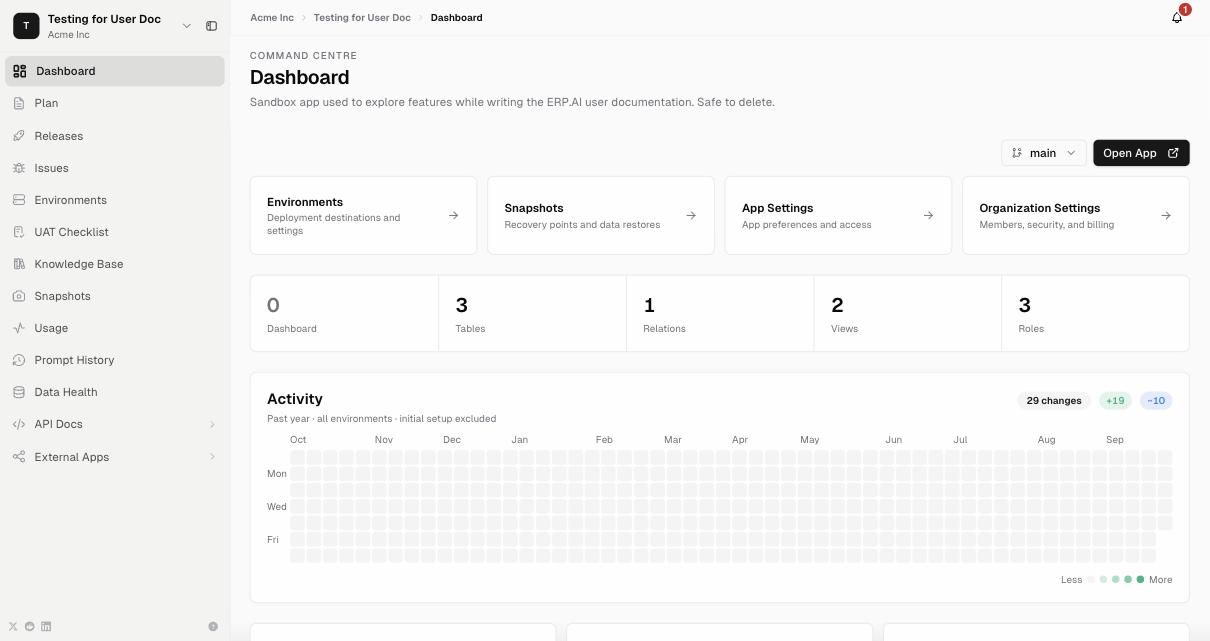
Sections
| Section | What it’s for |
|---|---|
| Dashboard | App summary: counts of dashboards, tables, relations, views, and roles; an Activity heatmap of changes over the past year; status cards for Changes, Quality, and Delivery; and shortcuts to Environments, Snapshots, App Settings, and Organization Settings. Use the branch selector (for example main) to switch environments. |
| Plan | Keep the app’s purpose and scope clear. Shows Plan Intelligence: app description, counts (tables, relations, views, roles, pages), an Entity Relationship Diagram of every table and field, a list of tables with column types and required flags, and a list of relationships (for example Orders.Customer references Customers). |
| Releases | Review changes to the app’s structure and prepare controlled releases. See Releases, environments, and snapshots. |
| Issues | Triage bugs, feature requests, and change requests. Shows blockers, net velocity over 30 days, assignee load, and a Table or Board of issues, filtered by category and status (All, Open, Active, Done). Click New issue to log one. |
| Environments | Deployment destinations (for example main = Production), deploy requests, and deploy metrics. |
| UAT Checklist | Acceptance checks that must pass before changes can go to production, grouped into General, QA, Security, and Performance. Click Add your first item. |
| Knowledge Base | Source material the app and its AI features can use, such as documentation, guides, spec sheets, walkthrough videos, and links. Click Add resource. |
| Snapshots | Recovery points and scheduled backups. See Releases, environments, and snapshots. |
| Usage | Runtime adoption and resource use: total events, branches, activity trend, and counts of views, documents, workflow runs, workflows, records, roles, tables, and users. Filter by 24h / 3d / 7d / 14d / 30d, switch between Metrics and Team, or click Sync now. |
| Prompt History | Every Proto chat for this app, including your messages, Proto’s replies, and the skills it used. Filter by people, status, and time. |
| Data Health | Checks whether the analytics copy of your data (used by reports, dashboards, and AI) is up to date. See below. |
| API Docs | REST API reference for each table and view. See API Docs and External Apps. |
| Forms | Public forms that let your website send submissions into tables you choose. See Public forms. |
| External Apps | Let outside apps and portals use your app’s data within limits you set. See API Docs and External Apps. |
Data Health explained
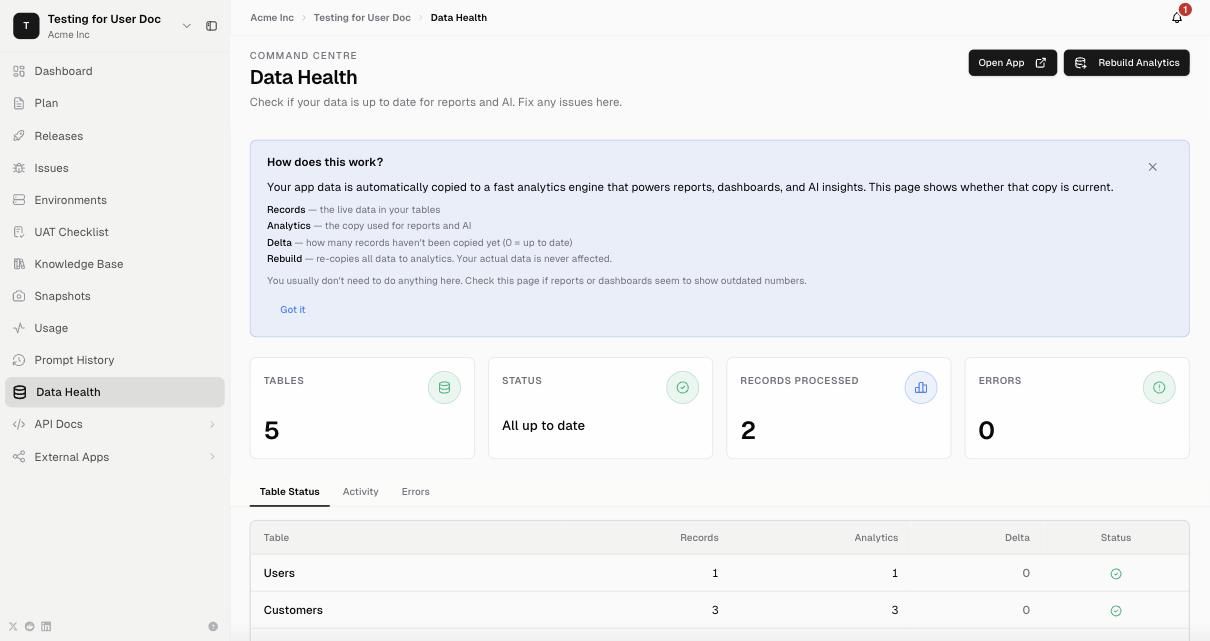
Your app’s data is copied automatically to a fast analytics engine that powers reports, dashboards, and AI insights. The Data Health page shows, for each table:
- Records: live data in your tables
- Analytics: the copy used for reports and AI
- Delta: how many records haven’t been copied yet (0 = up to date)
- Status and any Errors
Use the Table Status, Activity, and Errors tabs to see each table’s state, recent syncs, and problems. If dashboards seem to show outdated numbers, check here. When a table falls behind, the page shows whether automatic repair is available; rebuilding copies the data again. Your actual data is never affected.