Table insights (KPI cards)
Insights are cards that sit above a table and show key numbers, such as total orders, total quantity, or open tickets, so users see the important figures before they look at the rows.
Add insights to a table
- Open the table and click ⋯ → Configure insights. If insights already exist, click Edit insights instead.
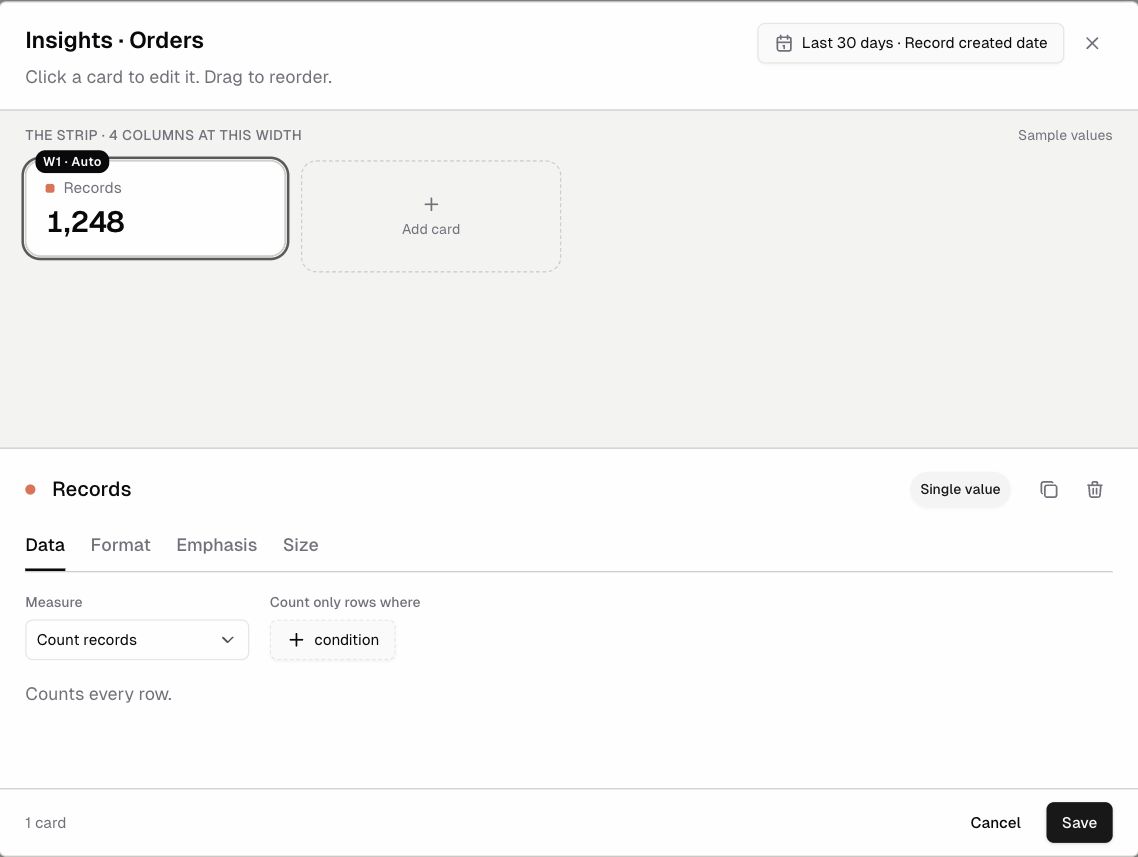
- The Insights · Table editor opens:
- Suggested for this table: ready-made cards based on your fields (for example Records, Total quantity, Total unit price, By created by).
- Or start from a shape: Single value, Progress to target, Trend over time, Breakdown bars, Donut.
- Click a suggestion or shape to add it. The card appears in the preview strip.
- Click a card to edit it. The editor has four tabs:
- Data: the Measure (for example Count records, or the sum of a number field) and Count only rows where conditions
- Format: number formatting
- Emphasis: highlighting and colors
- Size: card width
- Set the date range (top right, for example Last 30 days · Record created date).
- Drag cards to reorder them, then click Save.
Using insights
- Insights appear in a collapsible Insights strip above the table. It shows how many cards there are, the date range, and when the data was last updated.
- Use Refresh to update the numbers, the expand icon to see cards full-screen, and Edit insights to change them.